Following feedback from recent system testing I looked into a performance issue in my .NET based DSL interpreter. The interpreter coverts the travel industry DSL into .NET CLR calls through reflection.
I started by creating a unit test which performed a where clause on the result of a where clause where the target list was 1000 records.
The DSL looked something like this
@result=Itinerary.Notes.Where(Value Contains “Hello”).Where(Value EndsWith “World”)
This chained approach resulted 2000 iterations and took 5 seconds to execute.
I assumed that reflection was the problem so I reran my performance unit test after adding caching to my ExpressionTree. I was surprised to learn that the improvement was negligible (from 5.1 seconds to 5 seconds). The intention was to reduce the number of reflection calls based upon “common wisdom” that reflection is slow.
I then ran the VS2008 Performance Explorer/Wizard over the interpreter and spotted that a derived String.Concat method was using up the majority of working memory at runtime. I fixed this in the heaviest used method which tokenises the script before passing it to the expression parser (replacing a simple activeToken += currentChar style approach with a StringBuilder.Append(currentChar) approach).
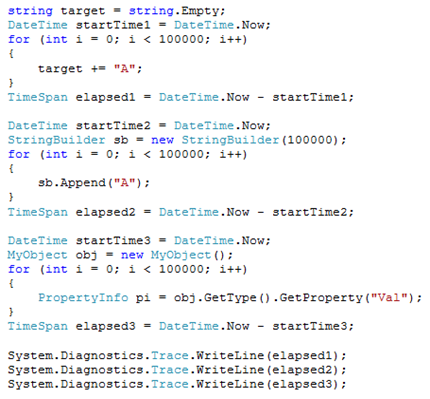
There were some interesting results...the following unit test demonstrates how a pre-initialised string builder can introduce a MASSIVE improvement in runtime speed. String concatenation is extremely slow, the string builder extremely fast and the reflection calls (contrary to common wisdom) are in fact really fast.
Results:
00:00:16.210400000:00:00
00:00:00.0780000


No comments:
Post a Comment